Another Look at the California Vaccination Data
Update: Updated to identify Catholic schools. (And again later, with more Catholic schools ID’d.)
I took another look at the vaccination exemption data I discussed the other day. This time I was interested in getting a closer look at the range of variation between different sorts of schools. My goal was to extract a bit more information about the different sorts of elementary schools in the state, just using the data from the Health Department spreadsheet. As we saw before, the smaller the unit of observation the more variability we are likely to uncover. So, looking at the rate of Personal Belief Exemptions (PBEs) in public vs private schools shows less variation than looking at the rates across counties, which in turn show less variation than what we observe at the district and school level. At the same time, the larger the number of observations within any particular category, the more variability there is likely to be as well. There are far more public schools than any other sort of school in California, so even if most public schools have very low rates of PBEs, the fact that there are thousands of them makes some outliers more likely.
To get a more fine-grained sense of the different sorts of schools there are, I used their names as a guide. How many private schools have the word “Christ” or “Christian” in their names, for example? How many have “Waldorf” or “Montessori”? This is an imperfect measure because it’s not guaranteed that, say, a private Christian academy will have the words “Christ” or “Christian” in its name. But it’s imperfect in a generally conservative direction—though not uniformly, as if you don’t search carefully you might mistake Christa McAuliffe Elementary, a public school, for a private Christian school. So you take care not to write regular expressions that aren’t too greedy, and double check against their public/private status, which is also given in the CDPH data. With this in mind we can produce a table of different types of schools ordered by mean PBE rate.
| Type | Mean PBE | Median PBE | Max PBE | Min PBE | N Schools | N Students |
|---|---|---|---|---|---|---|
| Private Waldorf | 47.49 | 44.19 | 84.21 | 20 | 16 | 513 |
| Public Montessori | 17.08 | 12.24 | 54.55 | 5.97 | 11 | 706 |
| Charter Montessori | 14.28 | 10.26 | 31.67 | 4.35 | 5 | 227 |
| Charter | 10.76 | 3.03 | 70.37 | 0 | 314 | 19,863 |
| Private Christian | 6.74 | 3.70 | 92.86 | 0 | 333 | 8,763 |
| Private Non-Specific | 5.89 | 0 | 86.96 | 0 | 596 | 16,795 |
| Private Montessori | 4.64 | 0 | 35.71 | 0 | 98 | 2,101 |
| Private Jewish or Islamic | 2.59 | 0 | 14.29 | 0 | 8 | 237 |
| Public | 2.33 | 0.81 | 75 | 0 | 5314 | 472,802 |
| Private Catholic | 1.80 | 0 | 27.78 | 0 | 333 | 8,855 |
| Private Christian Montessori | 1.25 | 0 | 5 | 0 | 4 | 78 |
The data show right away that, in addition to the broad differences between types, there’s both a a lot of variability in almost all the categories of school. Some of the categories have very few schools, but I’ve kept them for the sake of detail. The median charter, Christian, and private Montessori schools have relatively low PBE rates. Catholic schools have lower PBE rates than the public schools. Charter schools and charter Montessoris have much higher median PBEs—over ten percent. The same goes for an interesting group of public Montessoris (I didn’t know that California had public Montessoris before looking at this data.) The highest median PBE rate by far is in Waldorf schools, at 44 percent. There are just sixteen of these schools in the whole of California. We can look at the summary graphically, too:

California Kindergarten Average PBE Rates by Type of School, 2014-15.
We can also try to capture the heterogeneity of PBE rates across types of school:
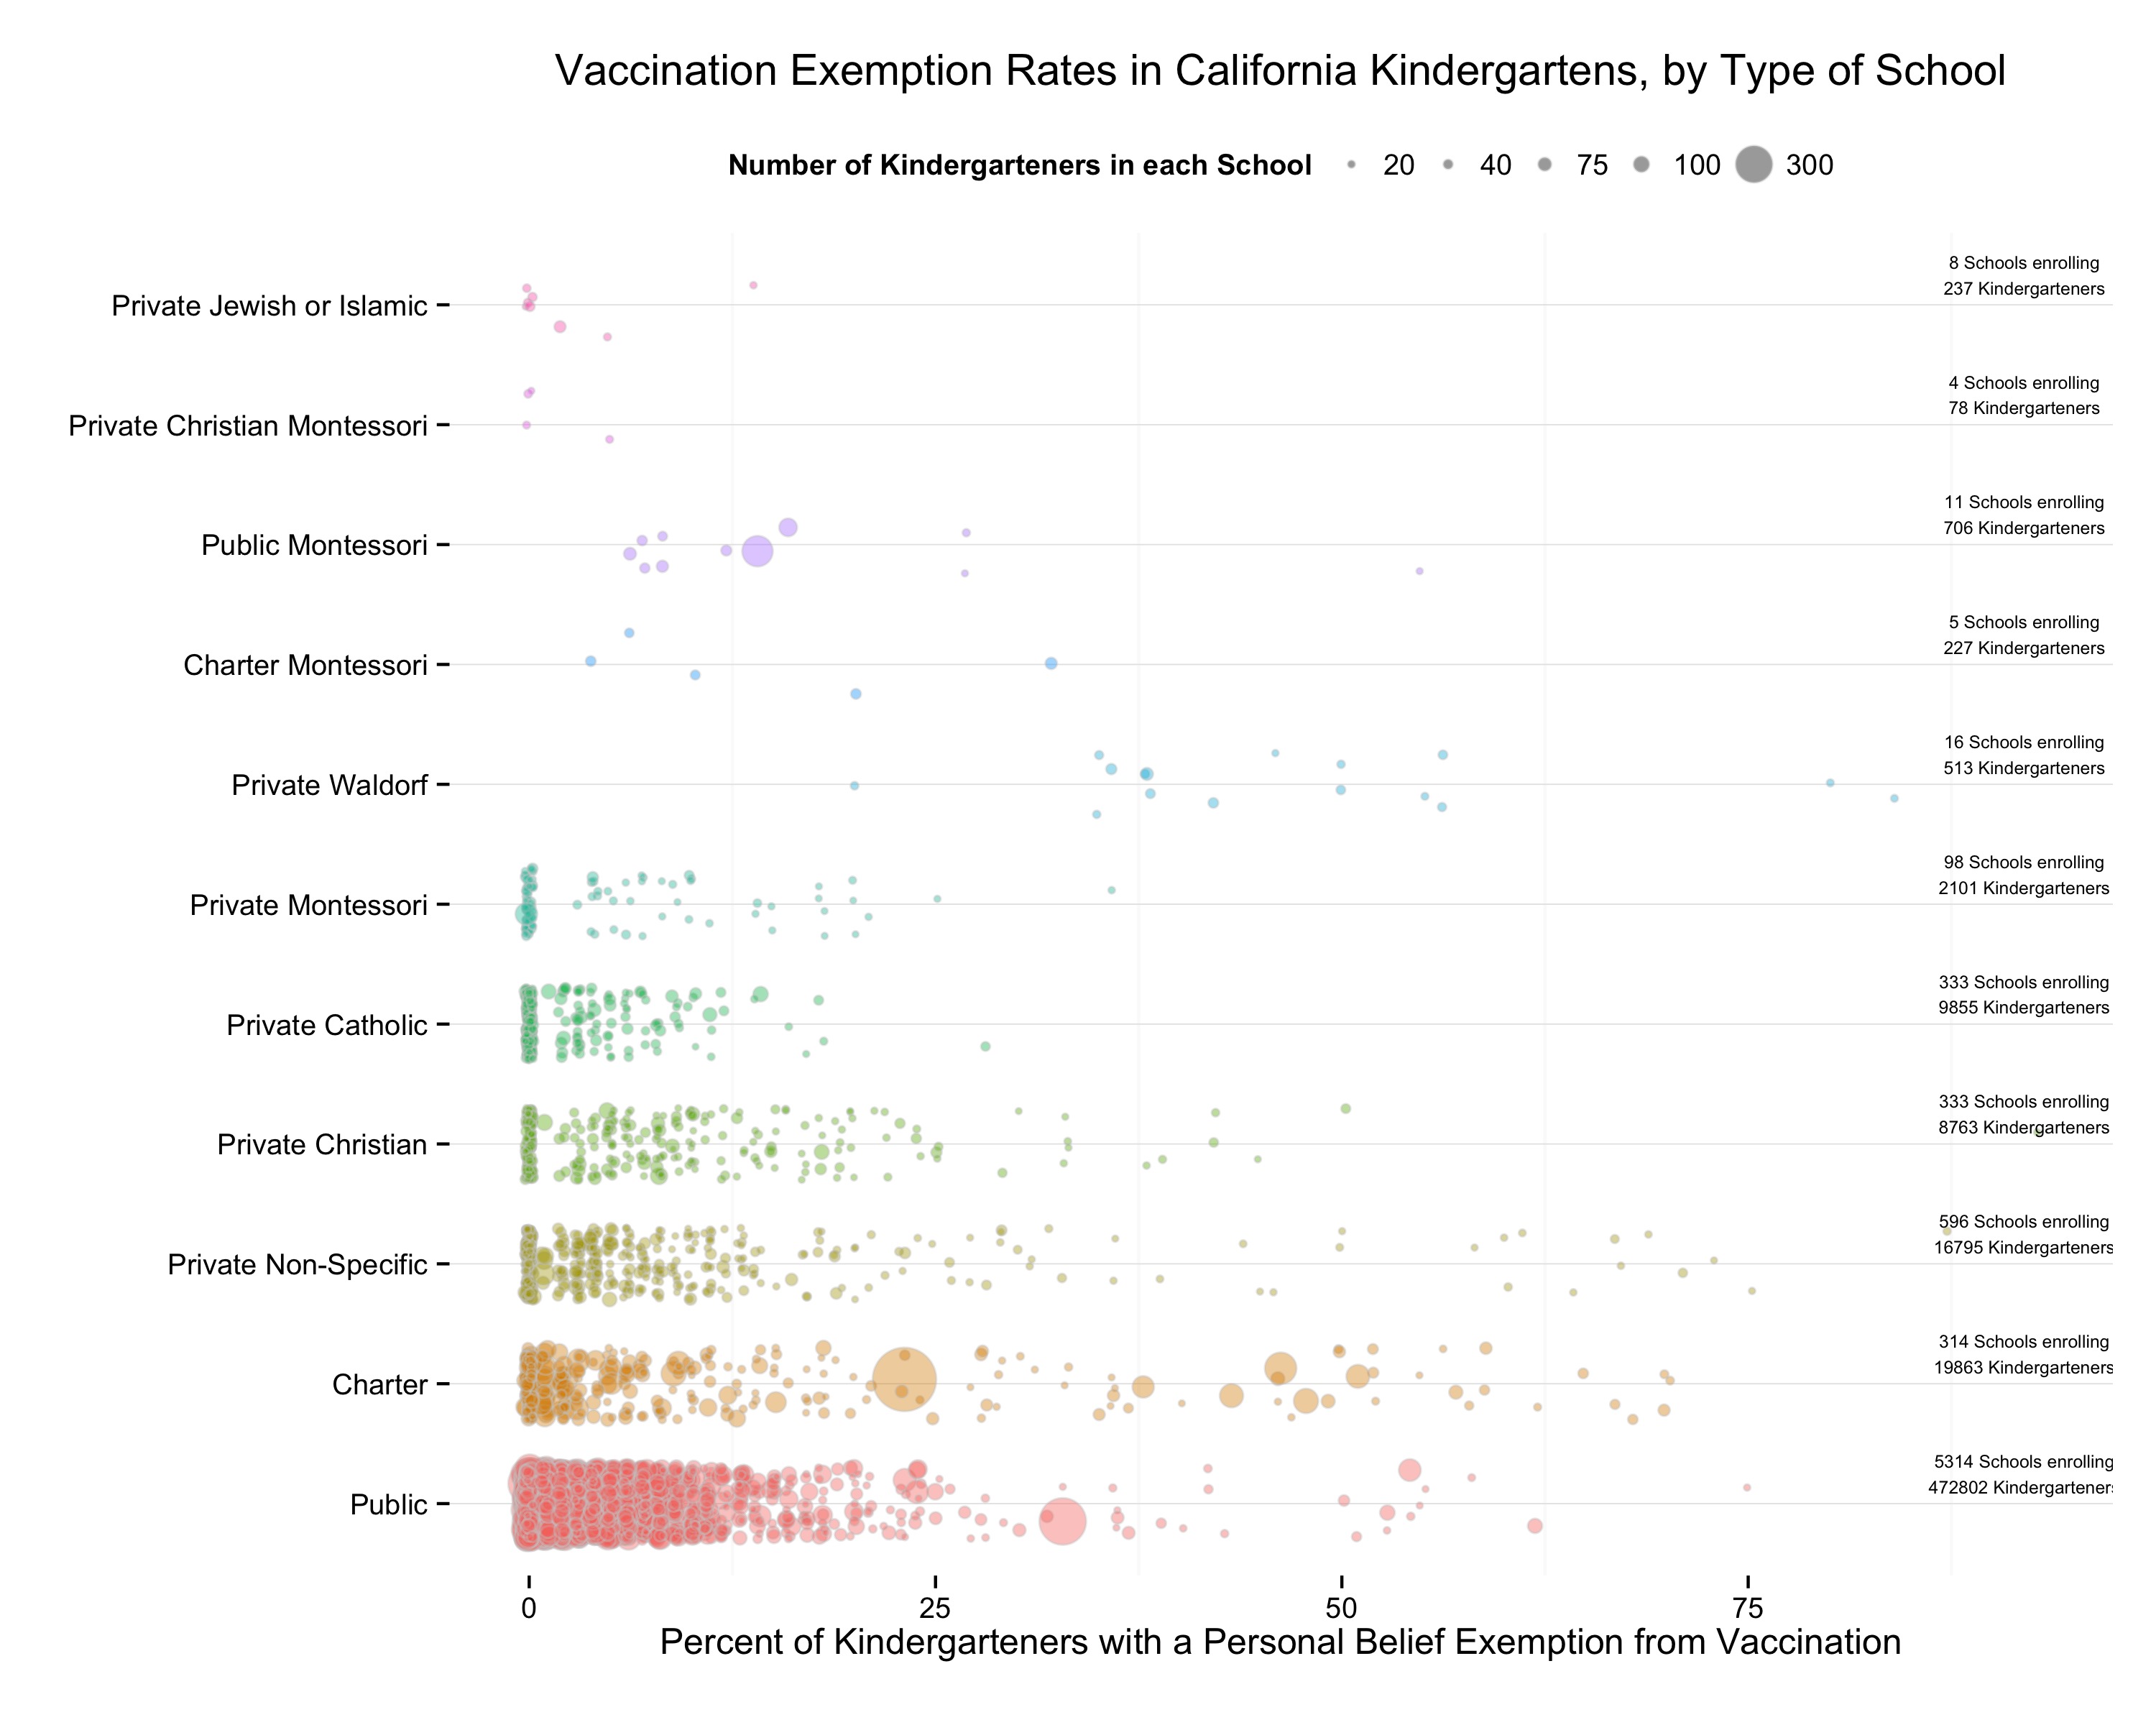
California Kindergarten PBE Rates by Type of School, 2014-15.
Each circle is a school. I’ve scaled them a little to reflect variation in the number of pupils enrolled. As before, this is kindergrarten enrollments not overall school size. Within each type of school, the vertical axis doesn’t mean anything: the points are just jittered a little to make them more easily visible. A note at the right hand side reminds you how many schools and how many students are represented in each row.
As I say, Montessori schools are interesting. Their patterns cut against the expected associations: there are private Montessoris with relatively high PBEs, but most of them are down around zero. The same goes for the small number of Christian Montessoris, which have near-zero PBE rates. Meanwhile charter Montessoris have high PBE rates, as do the public Montessoris. Perhaps unsurprisingly, three of the high-scoring public Montessoris are in Sacramento county, and two more are in nearby El Dorado and Nevada counties. Two of the Waldorf schools are also in Sacramento and one is in El Dorado county. Charter schools are also clearly overrepresented in the high-PBE group, and in contrast to, say, high-PBE private schools, many of them are relatively large. (Though some of the very largest are actually service providers to home-schoolers.) Meanwhile in the public schools, the large majority of students are concentrated in schools with low PBE rates. But because there are more than five thousand public schools there are plenty of high-scoring examples as well. Exploring the geographical distribution of these schools would be a natural next step to take with the data here. Even so, as we’ve seen, you can get a lot out of just the data in the basic spreadsheet. For example, here’s a county-level jitter plot with the school categories simplified, picking out high-risk (10 percent PBE or greater) schools. Counties are ordered from top to bottom by mean PBE rate.
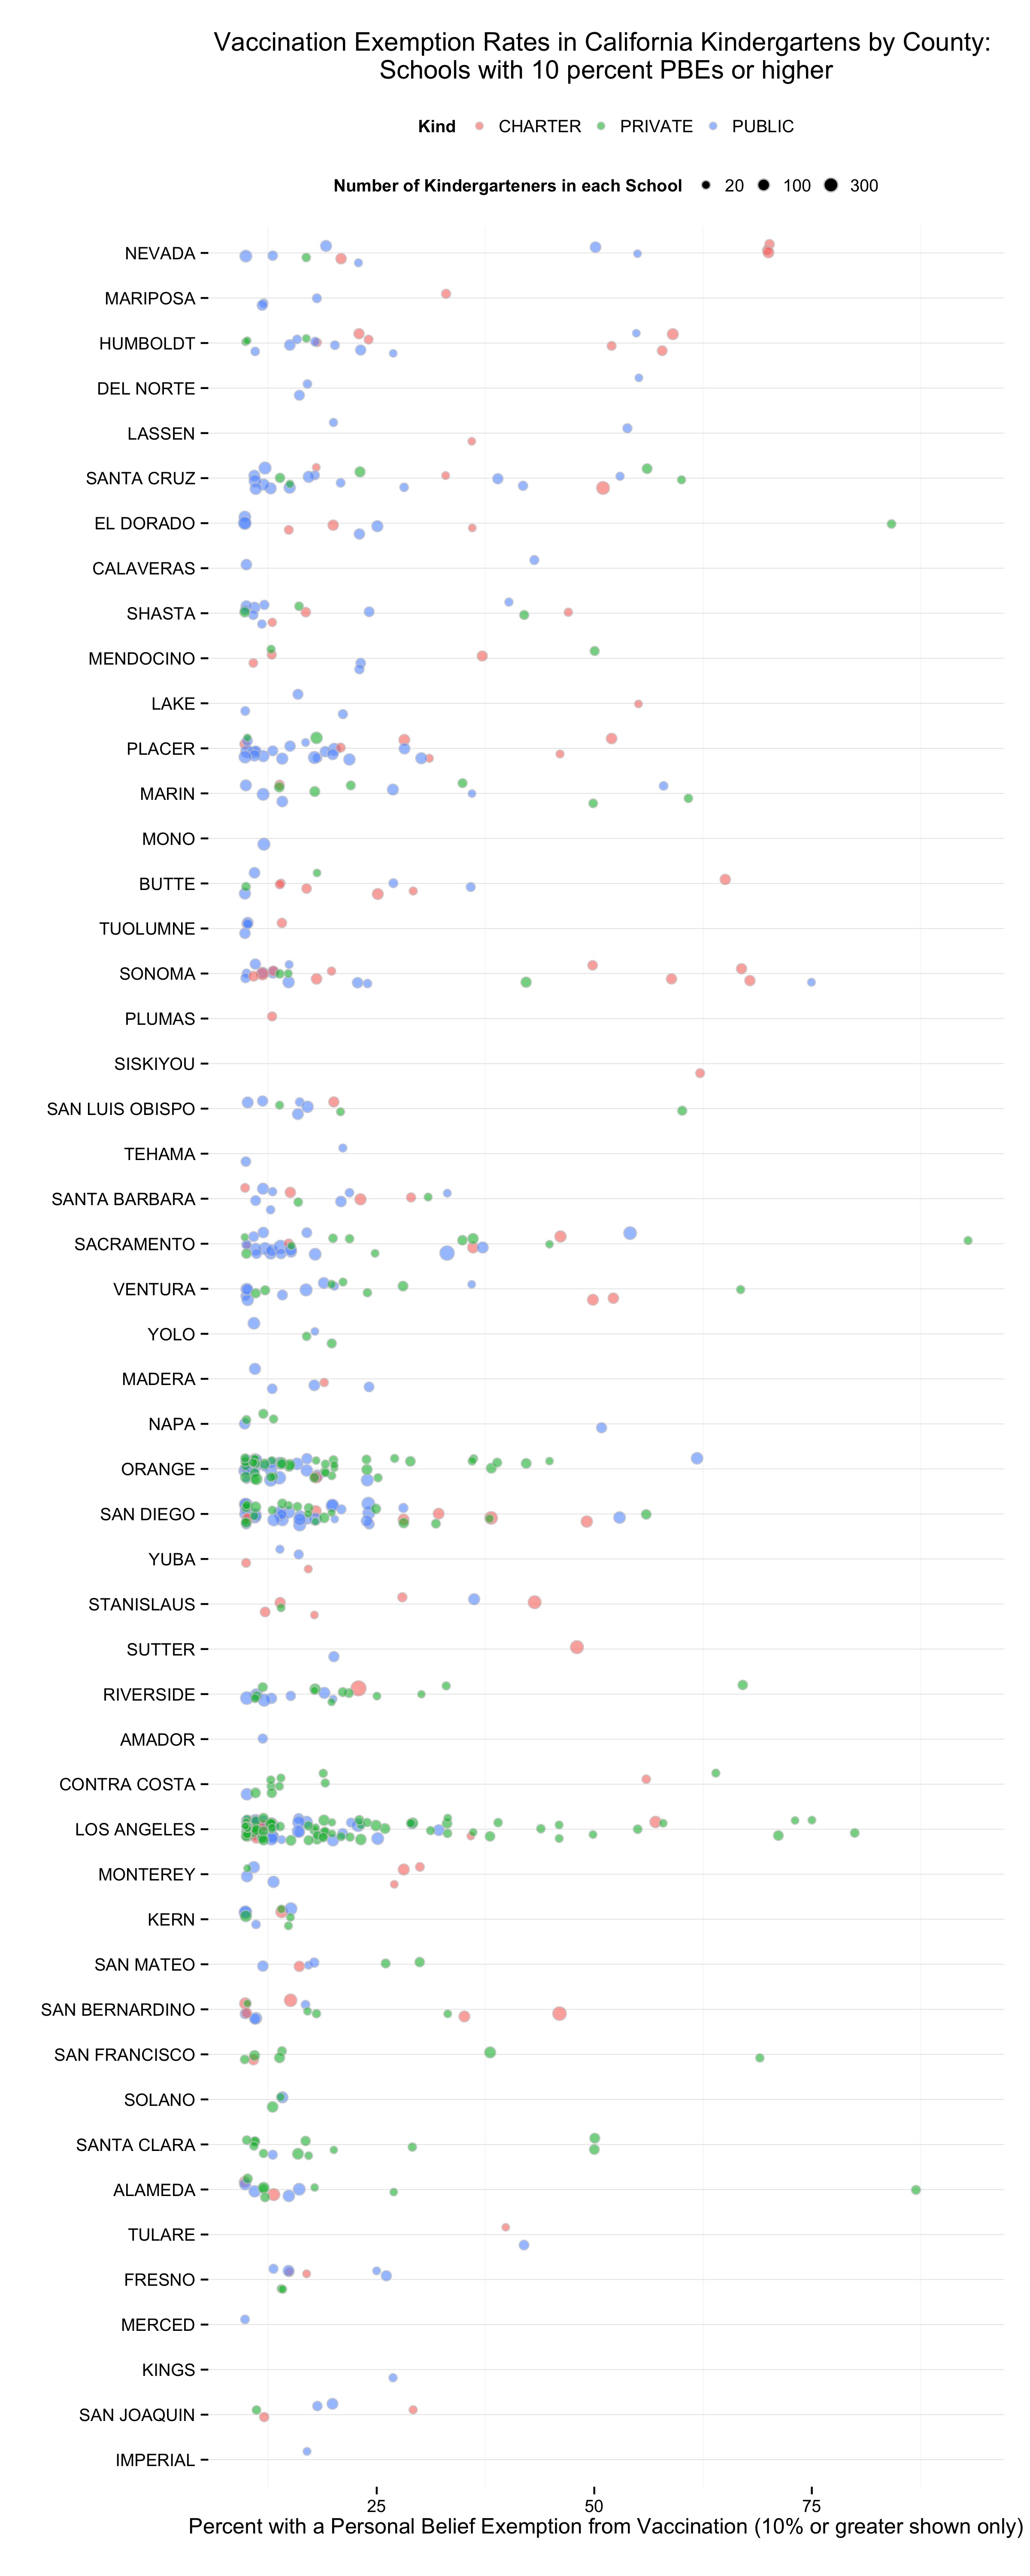
California Kindergarten PBE Rates by County, High PBE schools only, 2014-15.
Finally, to get a further sense how numbers of children are distributed across exemption rates, here is a mosaic plot of school types and binned exemption rates, where the size of each box or cell is proportional to the number of children in that category. This brings us back to the point that the vast majority of kindergarteners in California are in public school.
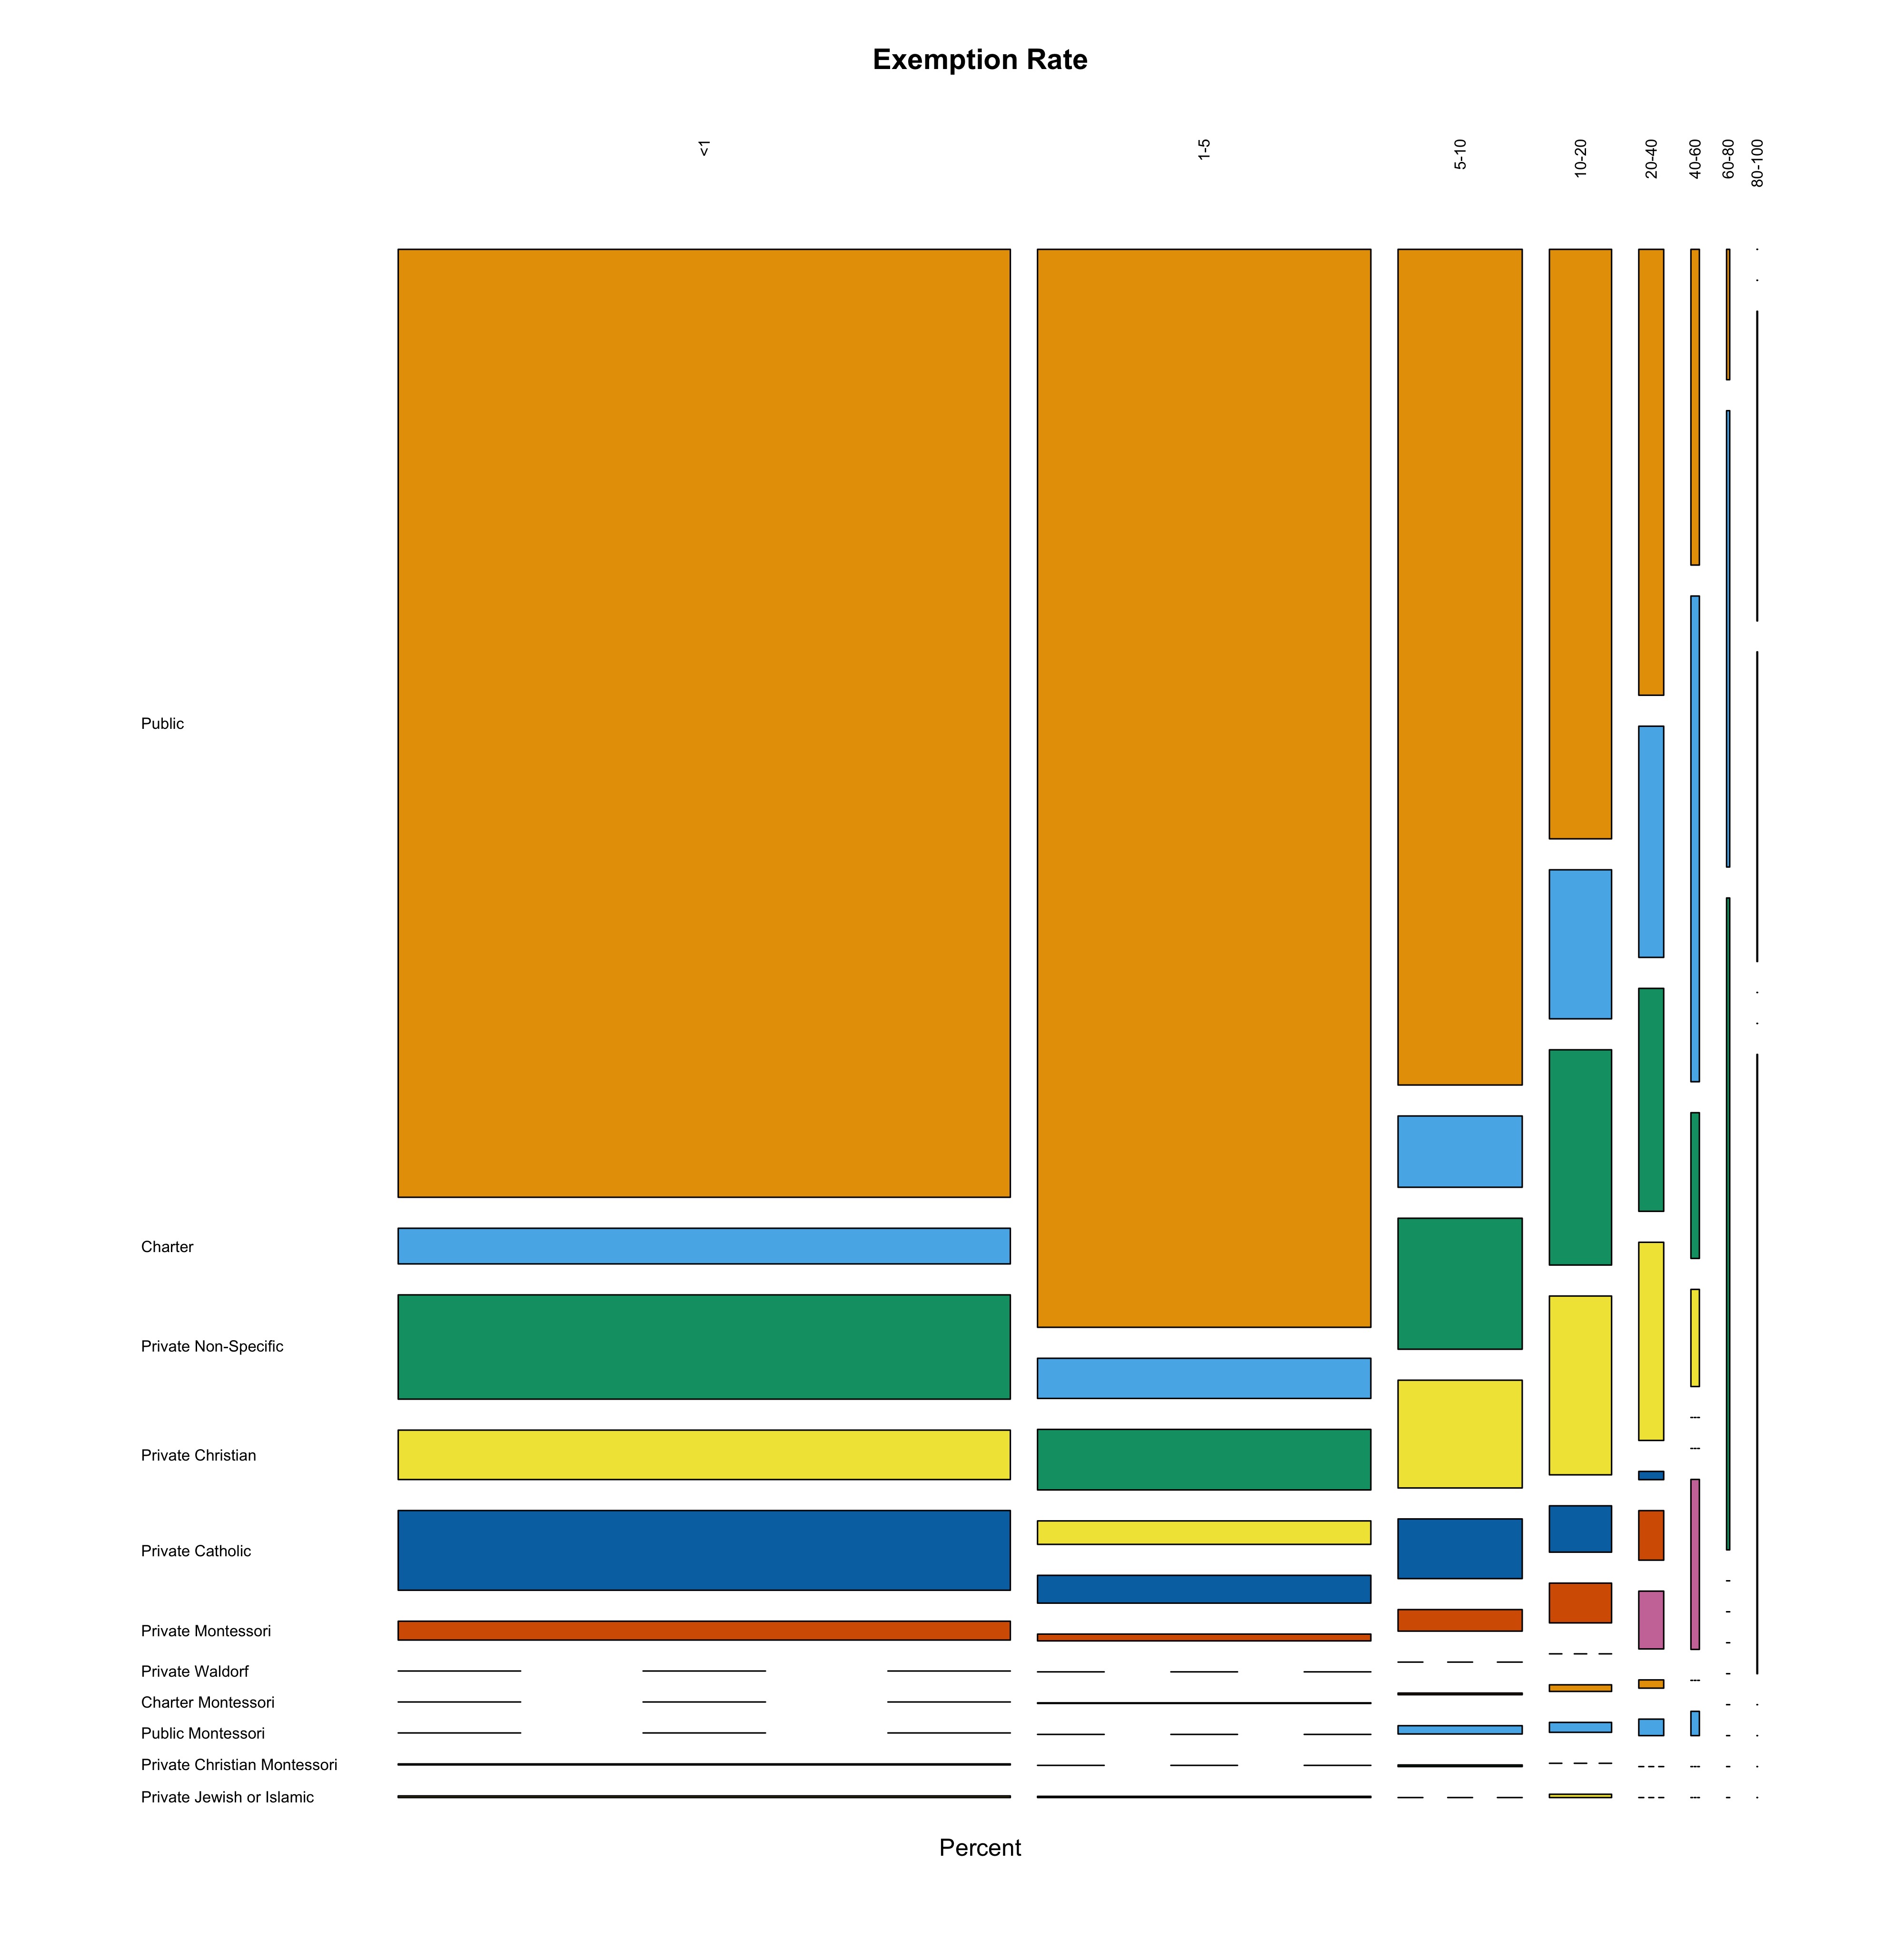
Mosaic Plot of California Kindergarten PBE Rates by School Type, 2014-15.